Honey | Tutorial | Intermediate
Non signal equations
In the previous tutorial, we saw how to specify a non-signal values using constants (e.g. 2) or variables (e.g. %w). Honey also support some basic numerical and textual equations to interact with non-signal values. A numerical equation starts with the symbol =. A textual equation starts with the symbol &. Both numerical and textual equations should follow the Polish equation notation.
For example, after executing the following command set %w =10,2,*,5,+, the variable %w will be equal to 20. Similarly, after executing the following command set %w "&hello, ,world,+,+", the variable %w will be equal to hello world.
Available numerical operators are: +, *, -, /, >, <,=, ^,>=, <=, !=, if, sin, cos, tan, log, rand, asin, acos, atan and sqrt. Available string operators are: +.
Signal equations
Similarly to non-signal equations, Honey support signal equations with the eq command.
The eq commands has two required parameters: a signal value and an equation. Additional signal value can also be provided.
As an example, the following command multiply records values by 2: $b = eq $a "value,2,*".
value is a keyword describing the value of the current record. time is a keyword linking to the current record time.
If additional signal values are provided, their respective values are accesses with the arg1, arg2, ... keywords.
For example, the following command divides the values of two channels: $c = eq $a "value,arg1,/" arg1:$c
Signal equations are also used by the passIf function to filter record according to their value.
For example, the following command will remove all the records with a value bellow 5: $b = passIf $a "value,5,>".
Note that eq and passIf are not very fast. On large datasets, and if possible, it might more interested to use other function (e.g. passIfFast).
File formats
Honey support several file formats to store SSTS. In the beginner tutorial, we already saw the csv format, the evt format as well as the directory format. In this section, we will talk again about these format, and we will seen some other more efficient format.
CSV format
The Honey .csv file is a text file that represent a two dimensional matrix. The first column contains timestamps while the other columns contain the numerical values of the different channels for each timestamps. Honey is able to detect the type of separator (tabulation, comma, semi-colon or space). Note that, if in your analysis you have a .csv file with a different "structure" (e.g. the time is expressed as text, symbolic attributes, relations or entities), you can use the dirty CSV importer that will be covered in the advanced tutorial.
Here is a typical example of honey .csv file.
0 10 11
0.1 10.5 11.1
2.2 10.4 NA
Note such csv file require for all the channels to be synchronized.
EVT format
A .evt file is a text file where each line specifies a record. Each line is {time-stamp} {channel name} {record value}. If the record value is omitted, Honey will assume a value of 1.
Optionally, and for compatibility purpose, a row can have a fourth value called the source. This value is not read nor used by honey.
0 price_apple 11
2 price_orange 10.5
2 price_apple 11.1
EVT format is especially useful when channels are not synchronized.
1 price_apple 5
1.1 price_orange 11.1
5.2 price_apple 2
BIN format
A .bin file is a compact binary encoding of a .evt file. The binary format is faster to read and write than the EVT and CSV formats. For this reason, the binary format is preferable in large datasets. Like the EVT format, the bin format handles naturally non-synchronized channels. You write an Honey program or use the Honey toolbox to convert files from and to the binary format. More details are given in the Honey command line reference.
SEVT format
The .sevt file is a text file that contact paths to other datasets files (.csv, .evt, .bin and .sevt). The main purpose of .sevt files is to help organizing large datasets. Sevt files are also extremely useful for deal with several SSTSs attached to several independent entities/sources.
Here is a simple example of .sevt file. In this example, all the files are merged together.
dataset dataset2.csv
dataset dataset3.evt
flush true
The dataset command accept three options. The first option is the path to the dataset. The second option (optional) is a prefix to add to each channel names in the dataset. The last option (also optional) is a regular expression to filter the channel to load in memory
Here is an example with prefix and filetering.
dataset dataset2.csv prefix2.
dataset dataset3.evt prefix3. (dog|cat)_.*
flush true
When processing several records from several independent sources, the SSTSs cannot simply be merged together. In this situation, the user has two solutions: The first is to apply the Honey program independently on the records of each source (with the use of directory input for example). However, this solution does not allows any cross or global analysis between the sources. The second solution, is to apply the "Titarl trick". The Titarl trick consists in merging all the datasets together, but to put enough "space" between them to make sure their don't interact. This spreading can be automatically done by Honey. Additionally, Honey will generate specific records indicating the beginning and end of each dataset segment. As you will see in the next section "Entities", you can do a lot with this simple trick.
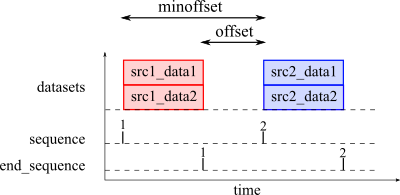
Here is an example of .sevt file and a plot illustrating the result. The space between datasets can be controlled by two parameters: offset and minoffset. Offset defines the space between the end of a dataset and the beginning of the next one. Minoffset defines the minimum space between the beginning of a dataset and the beginning of the next one.
sequence 1
dataset src1_data1.csv
dataset src1_data2.csv
flush
sequence 2
dataset src2_data1.csv
dataset src2_data2.csv
flush
Note that in this second example we use flush instead of flush true. flush true makes sure that time-stamps are modified.
By default, dataset path are should be relative to the current directory of the running process. In many cases, it is more interesting for the path to be related to the location of the .evt file. This can be enabled using the command basepath relative.
dataset dataset.csv
flush
You can also specify records in the .sevt file itself with the event command. This way to specify records is not efficient and should be reserved to load only few (often structual information about the source/entities). The syntax is event {time} {symbol} {value}. Note that the time will be shifted the same way at the datasets from the "dataset" command. The time can be a numerical value or one of the following two special jey words: begin or end. begin will set the time to be at the beginning of the dataset while end will set the time to be a the end of the dataset.
minoffset 3600
sequence 1
dataset group1_dataset1.csv
dataset group1_dataset2.csv
event 0 this_is_at_time_0 1
event begin this_is_the_beginning_of_sequence_1 1
event end this_is_the_end_of_sequence_1 1
flush
sequence 2
dataset group2_dataset1.csv
dataset group2_dataset2.csv
event begin this_is_the_beginning_of_sequence_2 1
event end this_is_the_end_of_sequence_2 1
flush
Entities
Honey can process records from different and independent entities. In this section we will see how to compute some global statistics/features about independent entities, and how to export these statistics into non-temporal csv files that can then be processed by any analytics framwork.
Suppose a dataset that describe maintenance operations on a set of vehicule. For each vehicule, the dataset contains a SSTS with various channels such as "inspection" or "change carburetor". You can suppose that the records of each vehicule is stored in a separated file in a directory (e.g. "vehicule_1.evt", "vehicule_2.evt"), or that the records of all the cars are in a same file (with the Titarl trick). For this example, we will suppose the Titarl trick representation (Honey can apply the Titarl trick for you with the a .sevt file). Additionnally, each vehicule has some static information such as the model or the color.
In this execice, we want to compute various statistics from the SSTS records of each vehicule, and we want the result to stored in a csv file where each row represents a vehicule, and each column represent a computed statistics about the vehicule. In this example, we will compute the number of inspection. Note that the final result is not a "temporal" dataset anymore and can easily be processed by any general data analytics framework (e.g. R, matlab, weka).
An important point with the Titarl trick is that the begining and end of each vehicle records is delimited by the "sequence" and "end_sequence" records. To compute global statistics about an entity (e.g. a vehicule), the "endsequence" can be used to "trigger" the statistics computation and exportation. As an example, computing once, at the end of a vehicule record, a moving count of the maintenance operations (count function) with a window length larger than the entire vehicule record, is acctualy equivalent to counting the total number of maintenance operations on this vehicule. The same concept can be applied for all the other Honey functions.
Here is an example of such program:
$all = echo #.*
$end_sequence = filter $all "end_sequence"
$intervention = filter $all "event.record"
set %record_duration 5000
$a = rename $end_sequence "vehicule_id"
$out += $a
$a = count $intervention %record_duration trigger:$end_sequence
$a = rename $a "number_of_intervention"
$out += $a
saveBufferedCsv $out file:%output saveTime:false
Report functions
Report functions are functions that requiere to have access to all the channels records at once to compute some (more or less complex) global statistics and report. Report functions do not generate any records. The result of report functions is generaly as a file (e.g. a picture, a table, a text file).
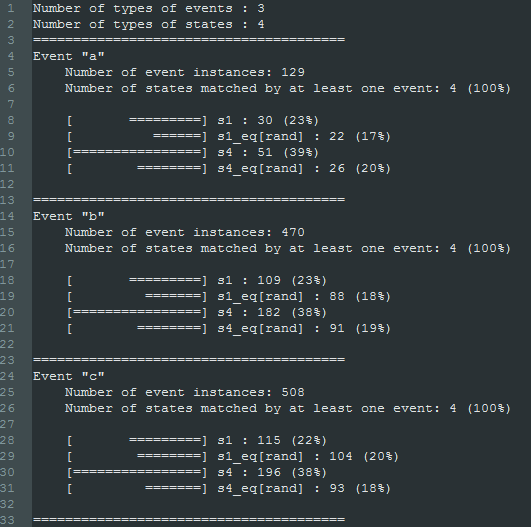
An example of report function is the report_histIntersectEventState function that produces a set of conditionnal histogram count of a set of channels according to another set of channels. The result are stored in a text file.
As an example, this function can be used to evaluate the distribution of a particular event (represented as a record) according to the hour of the day (which can be obtained by the calendar function).
The report_histIntersectEventScalar report function is similar to the report_histIntersectEventState function except that the values of the conditionnal variables are supposed continuous.
Another very important report function is the report_amoc function. This function evaluates the detection or forecasting capabilities of between a set of channels and a target channel. The result include several AMOC curves, a Tempororal ROC curve, as well as various cross-statistics, confidences intervals and p-values.
If your analitical work is based of forecasting or detection or rare events, I recommand that you read the documentation of the following functions: report_amoc, report_implication and report_predictorSelection as well as the tutorial on Titarl. Titarl is a framework (compatible with Honey and Event Viewer) to extract temporal rules and build forecastinf models.